By Paris Edwards, USDA Northwest Climate Hub
Water systems across the Northwest sustain crops, livestock, ecosystems, people and power production. These highly managed, interconnected networks of rivers, reservoirs, canals, and pipelines are economic mainstays for the region, and play a foundational role in food and energy security and sustaining natural resource livelihoods.
However, climate change has begun to challenge water resources by increasing temperatures, decreasing snowpack, and altering the timing and amount of available water (Regonda et al. 2005). Current water management systems are designed around historical norms and trends that are rapidly becoming outdated, due to increasing climate variability and uncertainty about future resources. As a region, we now have to reconsider how best to plan around and adapt to expected change in order to reduce and avoid negative consequences to the overall food-energy-water system and to community well-being. But where is such adaptation planning particularly urgent? We synthesized data from across the Northwest to answer this question.
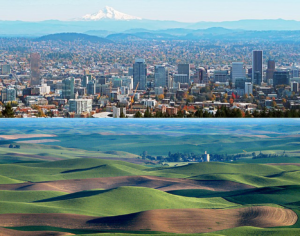
Adaptation planning is largely about anticipating future needs in balance with expected change. We recognize that appropriate adaptation strategies to address changes in water resources are specific to a particular place and influenced by many factors, including the hydrological characteristics of each place, and the socio-economic characteristics of the communities that live there. For example, adaptation plans that are appropriate for a rural, agricultural community in the arid inland portion of the region should be different from plans for a densely populated, urban community on the wetter coastal side (Figure 1).
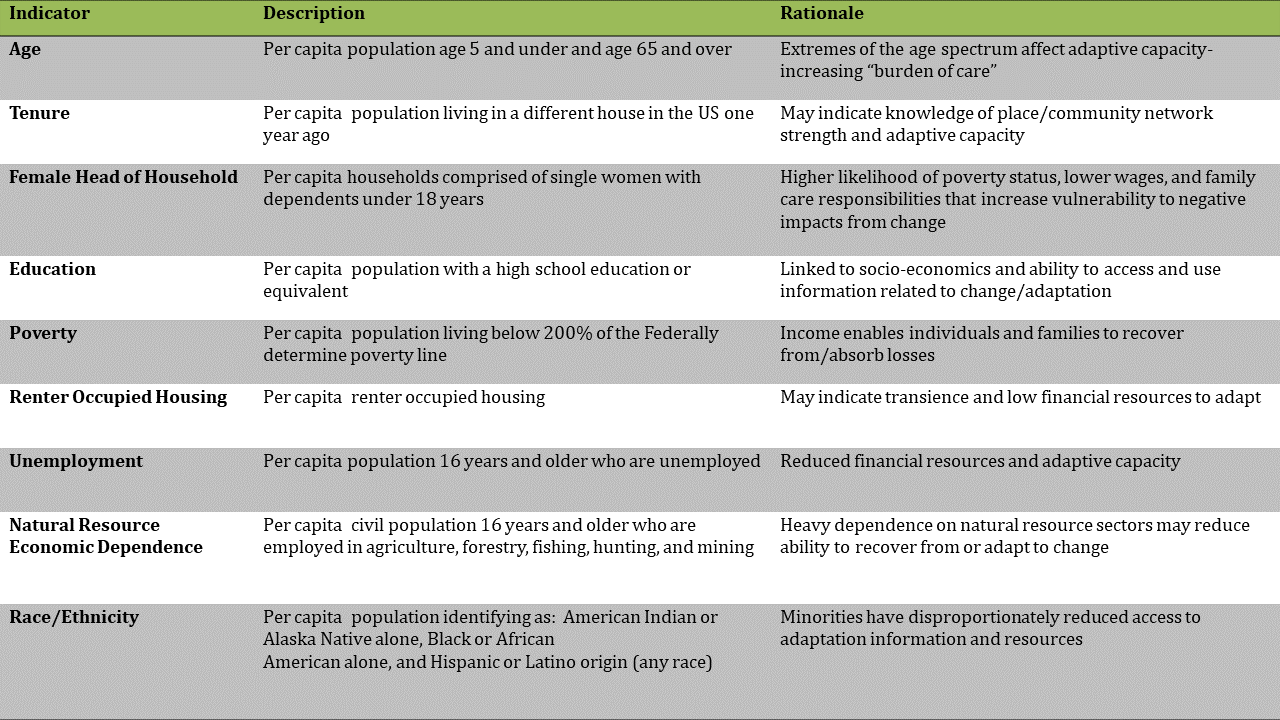
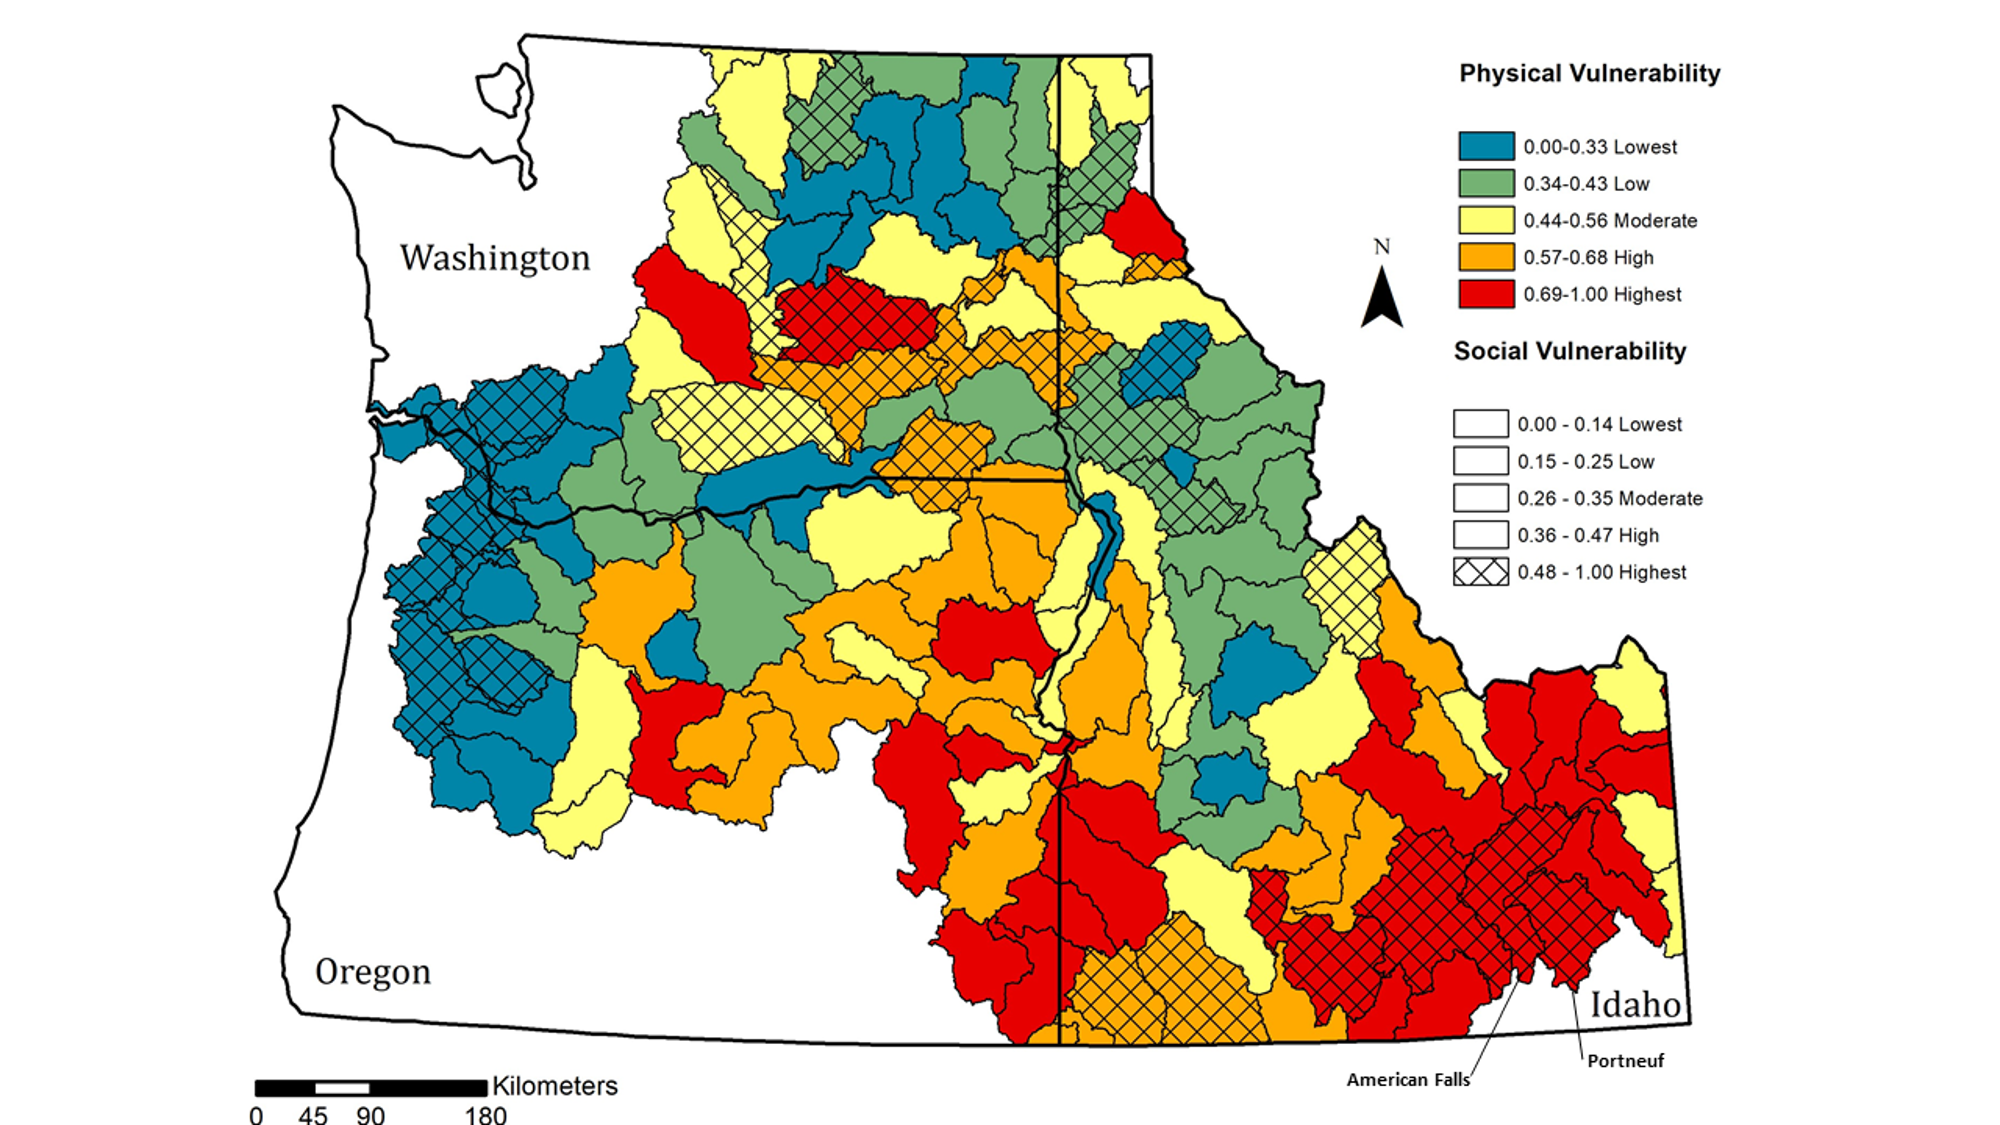
We engaged with water managers to develop a suite of social and hydrological variables indicative of sensitivity to increased water scarcity in the Northwest (Table 1 shows the 11 social vulnerability variables, and Table 2 shows the 10 hydrological vulnerability variables). Every variable was assigned a value (standardized from 0 to 1, with higher value = higher vulnerability) and these were summed and categorized from a low to high vulnerability score for each of 144 subbasins in Oregon, Idaho, and Washington. This simple, integrated index provides a “layercake” view of the region’s relative social and hydrological vulnerability by subbasin. We mapped the results to get a clearer view of subbasins that may be more vulnerable to climate change impacts on water resources (Figure 1). This approach allows for readily viewing geographic patterns of relative vulnerability and identifying coincidences or “hotspots” of overlapping social and hydrological vulnerability. We posit that vulnerability hotspots, in particular, may benefit from targeted adaptation resources, such as further study of on-the-ground exposure and sensitivity to water loss, and exploration of community-specific needs.
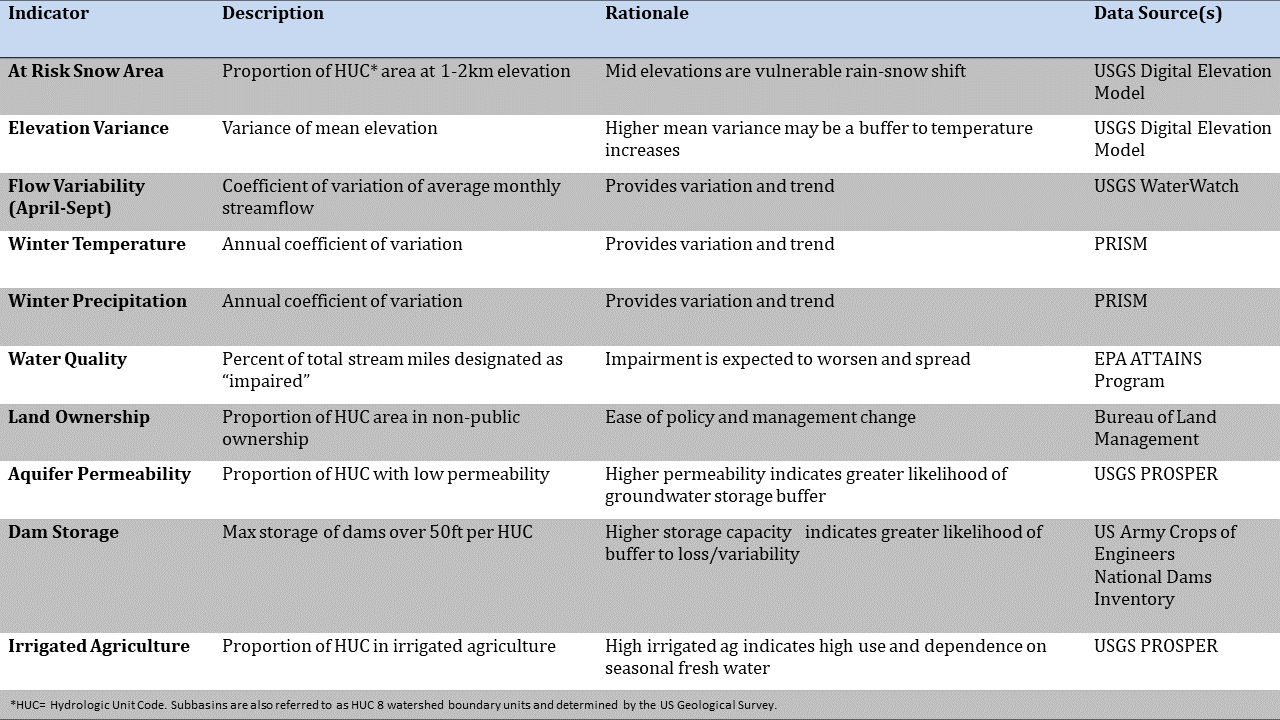
Our results suggest that, of the social variables considered (Table 1), age, poverty and household composition strongly influence overall social vulnerability across the region. We also found that social vulnerability associated with economic dependence on natural resources is most common among rural subbasins, while urban subbasins are more commonly influenced by minority status. This is also reflected in the map showing concentrations of high social vulnerability in urban, western Oregon subbasins and throughout the Snake River plain in southern Idaho (Figure 2). The results of our hydrological vulnerability analysis show a concentration of highly vulnerable subbasins clustered in eastern Oregon and southeastern Idaho (Figure 2). A high dependence on irrigated agriculture and potential for snowpack losses (higher proportion of 1,000-2,000 ft elevation range) strongly influence vulnerability to water loss in these areas. Overlapping high social and hydrological vulnerability or potential “hotspots” are located throughout southern Idaho, in eastern Oregon, and in central Washington. Two standout subbasins, American Falls and Portneuf in southeastern Idaho, show high overlapping social and hydrological vulnerability scores (Figure 2). These subbasins are home to two of the state’s largest population centers, intensive agricultural production, small-scale power production, and the Fort Hall Native American Reservation. While further research is needed to better understand community-scale needs and water challenges, the possibility of overlapping high social and hydrological vulnerability suggests the potential for lower capacity to adapt, coupled with higher likelihood of water loss and increased variability.
As the Northwest region’s climate changes, our food, energy and water resources change with it, and communities in some subbasins will be affected more than others. Our approach to viewing human and hydrological dimensions of vulnerability together tell a more complete story about where resource needs are concentrated. This approach may also facilitate collaboration and leveraging power among neighboring subbasins with shared needs and priorities. Regional scale vulnerability analyses are limited in detail, yet may provide a rationale for targeted, finer scale research. Such research can be aimed to help communities and their leaders be better informed and more nimble in their efforts to think ahead and take action with the most sensitive populations in mind.
This article was revised from the original version, titled “A Vulnerability Analysis for the Columbia River Basin’s Food-Energy-Water System,” published in November 2019 as part of the following report: Hall, S.A., Yorgey, G.G., Padowski, J.C., Adam, J.C. 2019. Food-Energy-Water: Innovations in Storage for Resilience in the Columbia River Basin. Progress Report for the Columbia River FEW Project. Available online at www.fewstorage.wsu.edu.
This work is described in further detail in Dr. Edwards’ dissertation, titled “Preparing for Water Change in the Columbia River Basin: An Integrated Analysis of Vulnerability and Climate Research Review” and upcoming publications. If you are interested in these documents, please contact Dr. Edwards at Paris.Edwards@usda.gov.
References:
Regonda, S. K., Rajagopalan, B., Clark, M., & Pitlick, J. (2005). Seasonal cycle shifts in hydroclimatology over the western United States. Journal of Climate, 18(2), 372-384.
The work described in this article was supported jointly by the National Science Foundation under EAR grant #1639458 and the U.S. Department of Agriculture’s National Institute of Food and Agriculture under grant #2017- 67004-26131, as well as the Washington State University Graduate School.
Comments