Reposted from Climate of the Inland Northwest US
After a couple very mild winters across the inland northwest, we’ve been dealt a cool hand over the past 90 days while signs of the earliest bloom on record are being reported across much of the eastern US. And it’s a pattern that doesn’t seem to show any signs of changing in the next 8-14 days.


The upper-level flow across the North American continent clearly shows the purple bullseye over the PNW (trough + cooler than normal airmass) while opposing anomalies are found upstream (south of the Aleutians) and downstream (over the southeastern US). This troughing has been associated with a southward shift in the jet stream off the west coast of the US leading a conga line of juicy storms to California as well as the southern parts of Idaho and Oregon. With much of the northwest north of the jet stream, cooler than normal air with several bouts of Arctic air made appearances in December and January.The most unusually cold temperatures the last three months were confined to the lower elevations of the Columbia Basin, Snake River Plain, and valleys in western Montana. The blanket of snowcover across the entire region in mid-December followed by a relatively dry pattern across Washington state, Northern Idaho and western Montana set the stage for numerous inversions.The persistence of cold this winter was a notable feature. Take, Ellensburg, Washington for example where the winter temperature was 7.4F below 1981-2010 normals. While the station didn’t set any record lows, all but a few days had below normal temperatures.


The map below shows the percent of days from December-February where the daily mean temperature was above historical (1981-2010) normals. For parts of the Columbia basin in central and eastern Washington, less than 10% of the days were above normal. Typically, the presence of some warm air infiltrating into the region during the winter, often associated with moisture (warm frontal sector of a midlatitude cyclone), will help mix inversions and contribute to snowmelt in valley floors. Not so much this winter.As a result, lowland snow cover, snow depth, and snow persistence were exceptional. A couple noteworthy stats:
- Spokane Int AP: 76 days in a row with snow depth >=1″ [Dec 9-Feb 22] 7th longest
- Boise Int AP: 15″ of snow depth [Jan 6th] most on record

For much of the region, this winter will go down as the coldest in over two decades. For many locations, including Walla Walla, WA (below), we have to go back to 1993 to find a winter as cold. However, if you take a closer look at the time series of winter temperatures, you might note that such cold winters are not unusual in the broader 100+ year climate record — we just have seen a relative absence of unusually cold temperatures regionally -and globally.The impacts of the unusually cold winter have been felt across a number of sectors. The cold temperatures and snow loads in the Treasure Valley in SW Idaho have had impacts on agriculture. Meanwhile, heavy snowfall has prompted Idaho Fish and Game to up the number of winter feeding sites for elk and deer in southern Idaho.
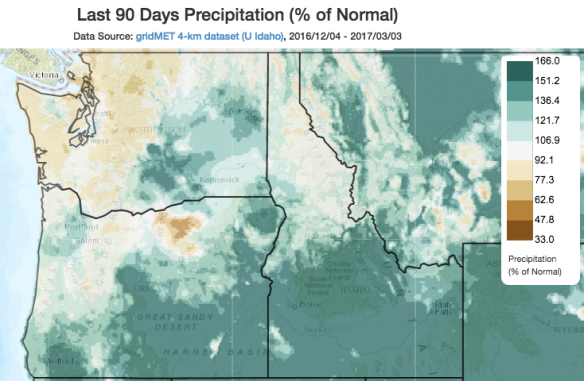

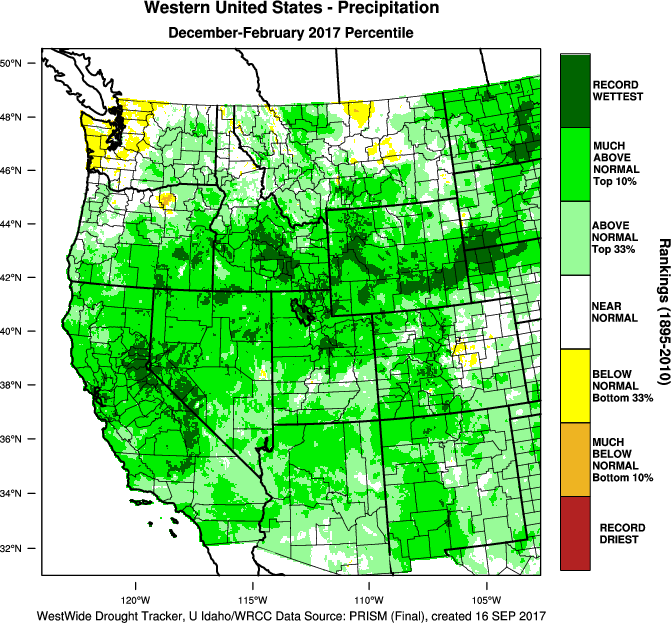
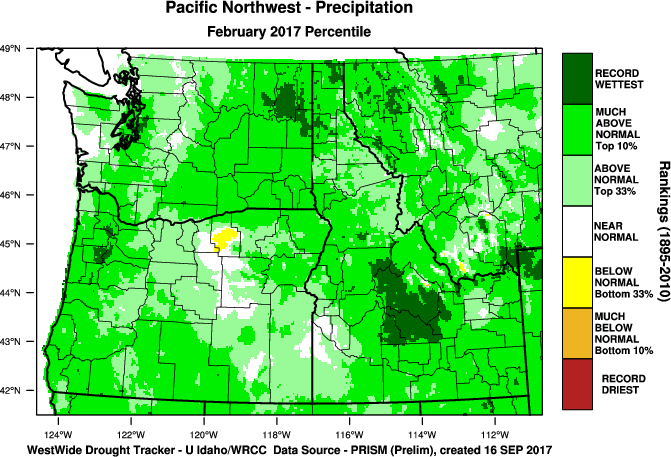
Precipitation has been a bit of a mixed bag the last 3 months, with record Dec-Feb precipitation from the San Francisco Bay Area north and eastward covering parts of southern Oregon and southern Idaho. By contrast, just north of the primary storm track and jet stream, normal to below-normal precipitation was seen over Washington state from the Cascades to the Pacific, and mountains of the Idaho panhandle and western Montana. Fortunately, February was quite wet across entire NW.Water year precipitation to date (Oct-Feb) has shown an incredible pattern where nearly the entire western US is above average. Typically, a north-south pattern emerges such as during a La Nina where the northwest is wetter than normal while the southwest is drier than normal. We technically had a La Nina this winter, although it was marginal at best. However, the precipitation patterns across the western US this winter with the weak La Nina, and last winter with the strong El Nino, haven’t played the part across the western US at large.
Not surprisingly, we have a healthy snowpack across most of the northwest, although there are a few locations in the Washington Cascades and Northern Rockies of Idaho and Montana that are lagging. On the flip side, above average to way above average snowpack covers much of Oregon and the southern half of Idaho into western Wyoming. The bullish precipitation forecast for the next week might very well reshape this map.

Comments